
How it works
The cash flow is the list of money in and out by year. Write that list first.
- Freeze the cash rules. Move one knob. Record the rank.
- Typical knobs: rate, CAM, commencement, and credit timing.
- Show a small grid. Do not bury it.
- If every test keeps the same winner, say that in one sentence.
Formula in words. Same leases, one changed input, new NPV pair, same story format.
| Input | Meaning |
|---|---|
| Base case | The main ranking |
| Test knobs | Rate, extras, timing |
| Flip note | Whether the winner changed |
Worked example
Here is a teaching sample. It is not customer data and not a result from a live client.
| Metric | Lease A | Lease B |
|---|---|---|
| Start rent | $40,000 | $37,200 |
| Year-1 extras | $9,200 | $9,844 |
| Year-1 credit | $9,000 | $4,950 |
| Sample NPV | $371,535 | $358,419 |
| Year | Rent | Extras | Credit | Cash out | Value today |
|---|---|---|---|---|---|
| Year 1 | $40,000 | $9,200 | $9,000 | $40,200 | $37,222 |
| Year 2 | $41,600 | $9,476 | $0 | $51,076 | $43,789 |
| Year 3 | $43,264 | $9,760 | $0 | $53,024 | $42,092 |
| Year 4 | $44,995 | $10,053 | $0 | $55,048 | $40,462 |
| Year 5 | $46,794 | $10,355 | $0 | $57,149 | $38,895 |
| Year 6 | $48,198 | $10,666 | $0 | $58,864 | $37,094 |
| Year 7 | $49,644 | $10,986 | $0 | $60,630 | $35,377 |
| Year 8 | $51,133 | $11,316 | $0 | $62,449 | $33,739 |
| Year 9 | $52,667 | $11,655 | $0 | $64,322 | $32,177 |
| Year 10 | $54,247 | $12,005 | $0 | $66,252 | $30,687 |
| Sample NPV | — | — | — | — | $371,535 |
How to read the sample
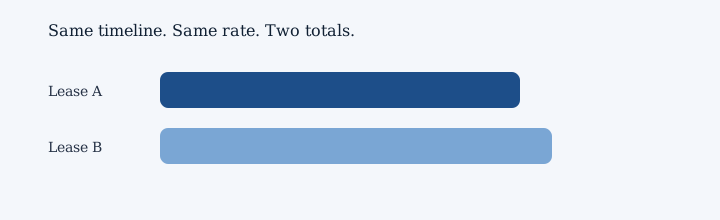
Sample NPV for the base-case lease is about $371,535. A second path lands near $358,419. That gap is a talking point, not a promise.
The base case starts here. If one path wins only because a credit sat in the wrong year, start over.
Year notes for the base-case lease
- Year 1 of the base-case lease has rent of $40,000.
- Shared building cost is $9,200.
- A credit of $9,000 lowers the cash you pay that year.
- Cash out this year is about $40,200. The base case starts here.
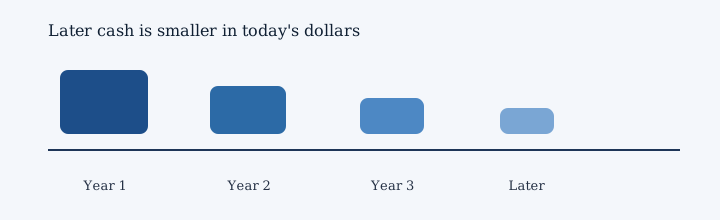
- Later cash gets a shrink for time. At 8 percent, year 1 is worth about $37,222 today.
- Next, year 2 rent is $41,600.
- CAM, which is a shared building cost, is $9,476.
- There is no credit in this year.
- You pay about $51,076 this year after extras and credits. A higher rate would shrink these later years more.
- Time shrinks later cash. At 8 percent, year 2 is worth about $43,789 today.
- Then year 3 rent is $43,264.
- Extras for the building come to $9,760.
- Credits skip this year.
- The net cash this year is about $53,024. A CAM surprise would lift this row.
- Waiting has a price. At 8 percent, year 3 is worth about $42,092 today.
- After that, year 4 rent is $44,995.
- The shared building cost this time is $10,053.
- No extra credit shows up this year.
- Cash out this year is about $55,048. A late commencement would slide the whole path.
- Later cash gets a shrink for time. At 8 percent, year 4 is worth about $40,462 today.
- In year 5 of the base-case lease, rent is $46,794.
- Shared building cost is $10,355.
- There is no credit in this year.
- You pay about $57,149 this year after extras and credits. The last year is a common flip zone.
- Time shrinks later cash. At 8 percent, year 5 is worth about $38,895 today.
- Year 6 of the base-case lease has rent of $48,198.
- CAM, which is a shared building cost, is $10,666.
- Credits skip this year.
- The net cash this year is about $58,864. Keep this later year in the sum for the sample.
- Waiting has a price. At 8 percent, year 6 is worth about $37,094 today.
- Next, year 7 rent is $49,644.
- Extras for the building come to $10,986.
- No extra credit shows up this year.
- Cash out this year is about $60,630. The row still belongs in the sum for the long path.
- Later cash gets a shrink for time. At 8 percent, year 7 is worth about $35,377 today.
- Then year 8 rent is $51,133.
- The shared building cost this time is $11,316.
- There is no credit in this year.
- You pay about $62,449 this year after extras and credits. Keep this later year in the sum for the long path.
- Time shrinks later cash. At 8 percent, year 8 is worth about $33,739 today.
- After that, year 9 rent is $52,667.
- Shared building cost is $11,655.
- Credits skip this year.
- The net cash this year is about $64,322. The row still belongs in the sum for the long path.
- Waiting has a price. At 8 percent, year 9 is worth about $32,177 today.
- In year 10 of the base-case lease, rent is $54,247.
- CAM, which is a shared building cost, is $12,005.
- No extra credit shows up this year.
- Cash out this year is about $66,252. Keep this later year in the sum for the long path.
- Later cash gets a shrink for time. At 8 percent, year 10 is worth about $30,687 today.
Add those year values. The sample NPV for the base-case lease is about $371,535. This is a teaching sample, not a client result.
Questions this topic answers
These are the standalone authority pages in this family. They are grouped so a reader can start, calculate, compare, or go deeper without a wall of cards.
Start here
Calculate it
For your role
Trusted sources
These are public references. They are not endorsements and not client results.
How to use this with OccupancyNPV
This page answers the concept. OccupancyNPV applies it inside a DealWorkspace: enter lease scenarios, review cash-flow and occupancy cost, then compare NPV and discount-rate sensitivity. OccupancyNPV NPV is not the same as a face-rent comparison. OccupancyNPV is not a CRM or lease-administration suite, and this page is not legal or investment advice.
Next: start the 3-day free trial, open pricing, or continue through related product paths.