

How it works
The cash flow is the list of money in and out by year. Write that list first.
- Write the base winner.
- Change the discount rate and record the new rank.
- Then change CAM and record again.
- Last, change credit timing. Stop when the next test is theater.
Formula in words. If NPV(A) and NPV(B) change order after one honest input change, report a flip.
| Input | Meaning |
|---|---|
| Base NPVs | The first rank |
| Changed input | One knob |
| New NPVs | The second rank |
Worked example
Here is a teaching sample. It is not customer data and not a result from a live client.
Lease A start rent$41,500
Lease B start rent$38,595
Discount rate8%
Sample NPV A$368,834
| Metric | Lease A | Lease B |
|---|---|---|
| Start rent | $41,500 | $38,595 |
| Year-1 extras | $8,700 | $9,309 |
| Year-1 credit | $11,000 | $6,050 |
| Sample NPV | $368,834 | $356,082 |
| Year | Rent | Extras | Credit | Cash out | Value today |
|---|---|---|---|---|---|
| Year 1 | $41,500 | $8,700 | $11,000 | $39,200 | $36,296 |
| Year 2 | $42,745 | $8,961 | $0 | $51,706 | $44,330 |
| Year 3 | $44,027 | $9,230 | $0 | $53,257 | $42,277 |
| Year 4 | $45,348 | $9,507 | $0 | $54,855 | $40,320 |
| Year 5 | $46,709 | $9,792 | $0 | $56,501 | $38,454 |
| Year 6 | $48,110 | $10,086 | $0 | $58,196 | $36,673 |
| Year 7 | $49,553 | $10,389 | $0 | $59,942 | $34,976 |
| Year 8 | $51,040 | $10,701 | $0 | $61,741 | $33,357 |
| Year 9 | $52,571 | $11,022 | $0 | $63,593 | $31,812 |
| Year 10 | $54,148 | $11,353 | $0 | $65,501 | $30,340 |
| Sample NPV | — | — | — | — | $368,834 |
How to read the sample
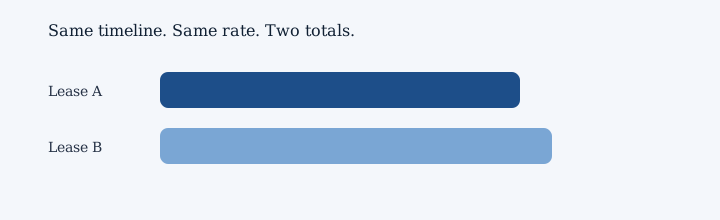
Sample NPV for the sensitivity sample is about $368,834. A second path lands near $356,082. That gap is a talking point, not a promise.
Base-case year one. If one path wins only because a credit sat in the wrong year, start over.
Year notes for the sensitivity sample
- Year 1 of the sensitivity sample has rent of $41,500.
- Shared building cost is $8,700.
- A credit of $11,000 lowers the cash you pay that year.
- Cash out this year is about $39,200. Base-case year one.
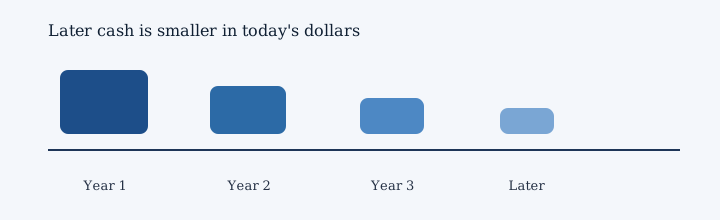
- Later cash gets a shrink for time. At 8 percent, year 1 is worth about $36,296 today.
- Next, year 2 rent is $42,745.
- CAM, which is a shared building cost, is $8,961.
- There is no credit in this year.
- You pay about $51,706 this year after extras and credits. A CAM test would lift extras here.
- Time shrinks later cash. At 8 percent, year 2 is worth about $44,330 today.
- Then year 3 rent is $44,027.
- Extras for the building come to $9,230.
- Credits skip this year.
- The net cash this year is about $53,257. A rate test would shrink this year more.
- Waiting has a price. At 8 percent, year 3 is worth about $42,277 today.
- After that, year 4 rent is $45,348.
- The shared building cost this time is $9,507.
- No extra credit shows up this year.
- Cash out this year is about $54,855. A start-date test would slide this row.
- Later cash gets a shrink for time. At 8 percent, year 4 is worth about $40,320 today.
- In year 5 of the sensitivity sample, rent is $46,709.
- Shared building cost is $9,792.
- There is no credit in this year.
- You pay about $56,501 this year after extras and credits. Flips often hide in the last years.
- Time shrinks later cash. At 8 percent, year 5 is worth about $38,454 today.
- Year 6 of the sensitivity sample has rent of $48,110.
- CAM, which is a shared building cost, is $10,086.
- Credits skip this year.
- The net cash this year is about $58,196. Keep this later year in the sum for the sample.
- Waiting has a price. At 8 percent, year 6 is worth about $36,673 today.
- Next, year 7 rent is $49,553.
- Extras for the building come to $10,389.
- No extra credit shows up this year.
- Cash out this year is about $59,942. The row still belongs in the sum for the long path.
- Later cash gets a shrink for time. At 8 percent, year 7 is worth about $34,976 today.
- Then year 8 rent is $51,040.
- The shared building cost this time is $10,701.
- There is no credit in this year.
- You pay about $61,741 this year after extras and credits. Keep this later year in the sum for the long path.
- Time shrinks later cash. At 8 percent, year 8 is worth about $33,357 today.
- After that, year 9 rent is $52,571.
- Shared building cost is $11,022.
- Credits skip this year.
- The net cash this year is about $63,593. The row still belongs in the sum for the long path.
- Waiting has a price. At 8 percent, year 9 is worth about $31,812 today.
- In year 10 of the sensitivity sample, rent is $54,148.
- CAM, which is a shared building cost, is $11,353.
- No extra credit shows up this year.
- Cash out this year is about $65,501. Keep this later year in the sum for the long path.
- Later cash gets a shrink for time. At 8 percent, year 10 is worth about $30,340 today.
Add those year values. The sample NPV for the sensitivity sample is about $368,834. This is a teaching sample, not a client result.
Trusted sources
These are public references. They are not endorsements and not client results.