
How it works
Write the cash list first. Then decide what the page is measuring.
- List base rent.
- Add tenant-paid extras.
- Add credits only in the year they happen.
- Divide by feet if you need a unit.
- Keep the list beside NPV, not instead of it.
Formula in words. Total occupancy cost = rent + CAM + tax + insurance + other tenant-paid extras − credits.
| Input | Meaning |
|---|---|
| Base rent | The rent line |
| CAM | Shared building cost |
| Tax | Tenant share |
| Insurance | Tenant share |
| Other | Utilities, parking, remaining build-out |
Worked example
Here is a teaching sample. It is not customer data and not a result from a live client.
Lease A start rent$30,000
Lease B start rent$27,900
Discount rate8%
Sample NPV A$355,924
| Metric | Lease A | Lease B |
|---|---|---|
| Start rent | $30,000 | $27,900 |
| Year-1 extras | $18,000 | $19,260 |
| Year-1 credit | $7,000 | $3,850 |
| Sample NPV | $355,924 | $352,500 |
| Year | Rent | Extras | Credit | Cash out | Value today |
|---|---|---|---|---|---|
| Year 1 | $30,000 | $18,000 | $7,000 | $41,000 | $37,963 |
| Year 2 | $30,900 | $18,540 | $0 | $49,440 | $42,387 |
| Year 3 | $31,827 | $19,096 | $0 | $50,923 | $40,424 |
| Year 4 | $32,782 | $19,669 | $0 | $52,451 | $38,553 |
| Year 5 | $33,765 | $20,259 | $0 | $54,024 | $36,768 |
| Year 6 | $34,778 | $20,867 | $0 | $55,645 | $35,066 |
| Year 7 | $35,821 | $21,493 | $0 | $57,314 | $33,442 |
| Year 8 | $36,896 | $22,138 | $0 | $59,034 | $31,894 |
| Year 9 | $38,003 | $22,802 | $0 | $60,805 | $30,418 |
| Year 10 | $39,143 | $23,486 | $0 | $62,629 | $29,009 |
| Sample NPV | — | — | — | — | $355,924 |
How to read the sample
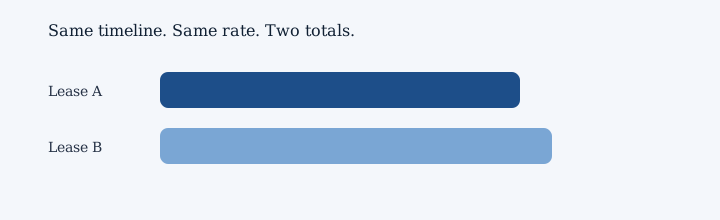
Sample NPV for Occupancy-stack sample is about $355,924. A second path lands near $352,500. That gap is a talking point, not a promise.
Year notes for Occupancy-stack sample
- Year 1 of Occupancy-stack sample has rent of $30,000.
- Shared building cost is $18,000.
- A credit of $7,000 lowers the cash you pay that year.
- Cash out this year is about $41,000. Extras nearly match rent in this net sample.
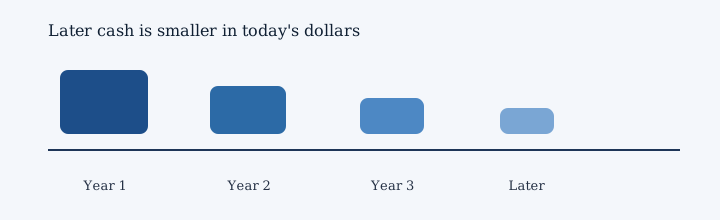
- Later cash gets a shrink for time. At 8 percent, year 1 is worth about $37,963 today.
- Next, year 2 rent is $30,900.
- CAM, which is a shared building cost, is $18,540.
- There is no credit in this year.
- You pay about $49,440 this year after extras and credits. The stack grows as the building ages.
- Time shrinks later cash. At 8 percent, year 2 is worth about $42,387 today.
- Then year 3 rent is $31,827.
- Extras for the building come to $19,096.
- Credits skip this year.
- The net cash this year is about $50,923. No credit remains after year one.
- Waiting has a price. At 8 percent, year 3 is worth about $40,424 today.
- After that, year 4 rent is $32,782.
- The shared building cost this time is $19,669.
- No extra credit shows up this year.
- Cash out this year is about $52,451. Later extras still belong in the budget.
- Later cash gets a shrink for time. At 8 percent, year 4 is worth about $38,553 today.
- In year 5 of Occupancy-stack sample, rent is $33,765.
- Shared building cost is $20,259.
- There is no credit in this year.
- You pay about $54,024 this year after extras and credits. The last year is a full occupancy year.
- Time shrinks later cash. At 8 percent, year 5 is worth about $36,768 today.
- Year 6 of Occupancy-stack sample has rent of $34,778.
- CAM, which is a shared building cost, is $20,867.
- Credits skip this year.
- The net cash this year is about $55,645. Keep this later year in the sum for the sample.
- Waiting has a price. At 8 percent, year 6 is worth about $35,066 today.
- Next, year 7 rent is $35,821.
- Extras for the building come to $21,493.
- No extra credit shows up this year.
- Cash out this year is about $57,314. The row still belongs in the sum for the long path.
- Later cash gets a shrink for time. At 8 percent, year 7 is worth about $33,442 today.
- Then year 8 rent is $36,896.
- The shared building cost this time is $22,138.
- There is no credit in this year.
- You pay about $59,034 this year after extras and credits. Keep this later year in the sum for the long path.
- Time shrinks later cash. At 8 percent, year 8 is worth about $31,894 today.
- After that, year 9 rent is $38,003.
- Shared building cost is $22,802.
- Credits skip this year.
- The net cash this year is about $60,805. The row still belongs in the sum for the long path.
- Waiting has a price. At 8 percent, year 9 is worth about $30,418 today.
- In year 10 of Occupancy-stack sample, rent is $39,143.
- CAM, which is a shared building cost, is $23,486.
- No extra credit shows up this year.
- Cash out this year is about $62,629. Keep this later year in the sum for the long path.
- Later cash gets a shrink for time. At 8 percent, year 10 is worth about $29,009 today.
Add those year values. The sample NPV for Occupancy-stack sample is about $355,924. This is a teaching sample, not a client result.
Trusted sources
These are public references. They are not endorsements and not client results.