
How it works
Write the cash list first. Then decide what the page is measuring.
- Build the yearly occupancy stack.
- Pick usable or rentable feet.
- Divide.
- Keep that basis on every option.
Formula in words. Occupancy cost per foot = yearly occupancy stack / chosen square feet.
| Input | Meaning |
|---|---|
| Yearly stack | Rent plus extras minus credits |
| Feet | Usable or rentable |
| Load factor | If you pay for shared hall |
Worked example
Here is a teaching sample. It is not customer data and not a result from a live client.
Lease A start rent$32,000
Lease B start rent$29,760
Discount rate8%
Sample NPV A$327,573
| Metric | Lease A | Lease B |
|---|---|---|
| Start rent | $32,000 | $29,760 |
| Year-1 extras | $12,000 | $12,840 |
| Year-1 credit | $5,000 | $2,750 |
| Sample NPV | $327,573 | $319,086 |
| Year | Rent | Extras | Credit | Cash out | Value today |
|---|---|---|---|---|---|
| Year 1 | $32,000 | $12,000 | $5,000 | $39,000 | $36,111 |
| Year 2 | $32,960 | $12,360 | $0 | $45,320 | $38,855 |
| Year 3 | $33,949 | $12,731 | $0 | $46,680 | $37,056 |
| Year 4 | $34,967 | $13,113 | $0 | $48,080 | $35,340 |
| Year 5 | $36,016 | $13,506 | $0 | $49,522 | $33,704 |
| Year 6 | $37,096 | $13,911 | $0 | $51,007 | $32,143 |
| Year 7 | $38,209 | $14,328 | $0 | $52,537 | $30,655 |
| Year 8 | $39,355 | $14,758 | $0 | $54,113 | $29,236 |
| Year 9 | $40,536 | $15,201 | $0 | $55,737 | $27,882 |
| Year 10 | $41,752 | $15,657 | $0 | $57,409 | $26,591 |
| Sample NPV | — | — | — | — | $327,573 |
How to read the sample
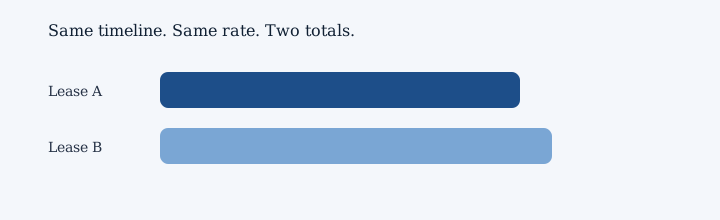
Sample NPV for Occupancy-per-foot sample is about $327,573. A second path lands near $319,086. That gap is a talking point, not a promise.
Year notes for Occupancy-per-foot sample
- Year 1 of Occupancy-per-foot sample has rent of $32,000.
- Shared building cost is $12,000.
- A credit of $5,000 lowers the cash you pay that year.
- Cash out this year is about $39,000. Year-one credits pull the foot number down.
- Later cash gets a shrink for time. At 8 percent, year 1 is worth about $36,111 today.
- Next, year 2 rent is $32,960.
- CAM, which is a shared building cost, is $12,360.
- There is no credit in this year.
- You pay about $45,320 this year after extras and credits. The stack rises as credits fade.
- Time shrinks later cash. At 8 percent, year 2 is worth about $38,855 today.
- Then year 3 rent is $33,949.
- Extras for the building come to $12,731.
- Credits skip this year.
- The net cash this year is about $46,680. Extras keep the foot number above face rent.
- Waiting has a price. At 8 percent, year 3 is worth about $37,056 today.
- After that, year 4 rent is $34,967.
- The shared building cost this time is $13,113.
- No extra credit shows up this year.
- Cash out this year is about $48,080. Later years set the long-term unit cost.
- Later cash gets a shrink for time. At 8 percent, year 4 is worth about $35,340 today.
- In year 5 of Occupancy-per-foot sample, rent is $36,016.
- Shared building cost is $13,506.
- There is no credit in this year.
- You pay about $49,522 this year after extras and credits. The last year is a full stack year.
- Time shrinks later cash. At 8 percent, year 5 is worth about $33,704 today.
- Year 6 of Occupancy-per-foot sample has rent of $37,096.
- CAM, which is a shared building cost, is $13,911.
- Credits skip this year.
- The net cash this year is about $51,007. Keep this later year in the sum for the sample.
- Waiting has a price. At 8 percent, year 6 is worth about $32,143 today.
- Next, year 7 rent is $38,209.
- Extras for the building come to $14,328.
- No extra credit shows up this year.
- Cash out this year is about $52,537. The row still belongs in the sum for the long path.
- Later cash gets a shrink for time. At 8 percent, year 7 is worth about $30,655 today.
- Then year 8 rent is $39,355.
- The shared building cost this time is $14,758.
- There is no credit in this year.
- You pay about $54,113 this year after extras and credits. Keep this later year in the sum for the long path.
- Time shrinks later cash. At 8 percent, year 8 is worth about $29,236 today.
- After that, year 9 rent is $40,536.
- Shared building cost is $15,201.
- Credits skip this year.
- The net cash this year is about $55,737. The row still belongs in the sum for the long path.
- Waiting has a price. At 8 percent, year 9 is worth about $27,882 today.
- In year 10 of Occupancy-per-foot sample, rent is $41,752.
- CAM, which is a shared building cost, is $15,657.
- No extra credit shows up this year.
- Cash out this year is about $57,409. Keep this later year in the sum for the long path.
- Later cash gets a shrink for time. At 8 percent, year 10 is worth about $26,591 today.
Add those year values. The sample NPV for Occupancy-per-foot sample is about $327,573. This is a teaching sample, not a client result.
Trusted sources
These are public references. They are not endorsements and not client results.