
How it works
Write the cash list first. Then decide what the page is measuring.
- Build the yearly effective rent.
- Divide by the feet you chose.
- Use the same foot basis on every option.
- Name usable versus rentable on the slide.
Formula in words. Effective rent per foot = yearly effective rent / chosen square feet.
| Input | Meaning |
|---|---|
| Yearly effective rent | After credits |
| Foot basis | Usable or rentable |
| Load factor | If you pay for shared hall |
Worked example
Here is a teaching sample. It is not customer data and not a result from a live client.
| Metric | Lease A | Lease B |
|---|---|---|
| Start rent | $52,000 | $48,360 |
| Year-1 extras | $7,800 | $8,346 |
| Year-1 credit | $13,000 | $7,150 |
| Sample NPV | $444,758 | $426,664 |
| Year | Rent | Extras | Credit | Cash out | Value today |
|---|---|---|---|---|---|
| Year 1 | $52,000 | $7,800 | $13,000 | $46,800 | $43,535 |
| Year 2 | $53,300 | $8,034 | $0 | $61,334 | $53,074 |
| Year 3 | $54,632 | $8,275 | $0 | $62,907 | $50,638 |
| Year 4 | $55,998 | $8,523 | $0 | $64,521 | $48,313 |
| Year 5 | $57,398 | $8,779 | $0 | $66,177 | $46,096 |
| Year 6 | $59,120 | $9,042 | $0 | $68,162 | $44,166 |
| Year 7 | $60,894 | $9,313 | $0 | $70,207 | $42,318 |
| Year 8 | $62,721 | $9,592 | $0 | $72,313 | $40,546 |
| Year 9 | $64,603 | $9,880 | $0 | $74,483 | $38,849 |
| Year 10 | $66,541 | $10,176 | $0 | $76,717 | $37,223 |
| Sample NPV | — | — | — | — | $444,758 |
How to read the sample
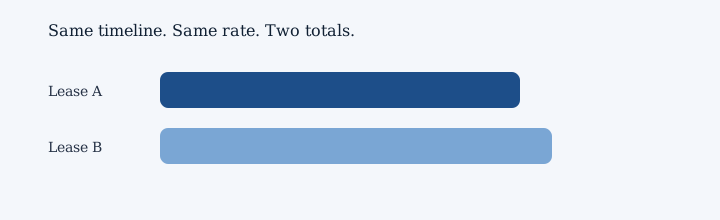
Sample NPV for Per-foot sample is about $444,758. A second path lands near $426,664. That gap is a talking point, not a promise.
Year notes for Per-foot sample
- Year 1 of Per-foot sample has rent of $52,000.
- Shared building cost is $7,800.
- A credit of $13,000 lowers the cash you pay that year.
- Cash out this year is about $46,800. The first year is lighter after credits.
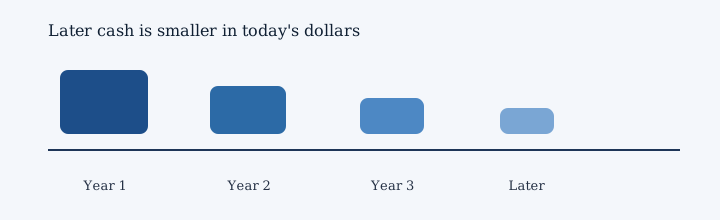
- Later cash gets a shrink for time. At 8 percent, year 1 is worth about $43,535 today.
- Next, year 2 rent is $53,300.
- CAM, which is a shared building cost, is $8,034.
- There is no credit in this year.
- You pay about $61,334 this year after extras and credits. The foot number rises as credits fade.
- Time shrinks later cash. At 8 percent, year 2 is worth about $53,074 today.
- Then year 3 rent is $54,632.
- Extras for the building come to $8,275.
- Credits skip this year.
- The net cash this year is about $62,907. The bump lifts the later average.
- Waiting has a price. At 8 percent, year 3 is worth about $50,638 today.
- After that, year 4 rent is $55,998.
- The shared building cost this time is $8,523.
- No extra credit shows up this year.
- Cash out this year is about $64,521. Later years set the long-term foot cost.
- Later cash gets a shrink for time. At 8 percent, year 4 is worth about $48,313 today.
- In year 5 of Per-foot sample, rent is $57,398.
- Shared building cost is $8,779.
- There is no credit in this year.
- You pay about $66,177 this year after extras and credits. The last year still belongs in the yearly figure.
- Time shrinks later cash. At 8 percent, year 5 is worth about $46,096 today.
- Year 6 of Per-foot sample has rent of $59,120.
- CAM, which is a shared building cost, is $9,042.
- Credits skip this year.
- The net cash this year is about $68,162. Keep this later year in the sum for the sample.
- Waiting has a price. At 8 percent, year 6 is worth about $44,166 today.
- Next, year 7 rent is $60,894.
- Extras for the building come to $9,313.
- No extra credit shows up this year.
- Cash out this year is about $70,207. The row still belongs in the sum for the long path.
- Later cash gets a shrink for time. At 8 percent, year 7 is worth about $42,318 today.
- Then year 8 rent is $62,721.
- The shared building cost this time is $9,592.
- There is no credit in this year.
- You pay about $72,313 this year after extras and credits. Keep this later year in the sum for the long path.
- Time shrinks later cash. At 8 percent, year 8 is worth about $40,546 today.
- After that, year 9 rent is $64,603.
- Shared building cost is $9,880.
- Credits skip this year.
- The net cash this year is about $74,483. The row still belongs in the sum for the long path.
- Waiting has a price. At 8 percent, year 9 is worth about $38,849 today.
- In year 10 of Per-foot sample, rent is $66,541.
- CAM, which is a shared building cost, is $10,176.
- No extra credit shows up this year.
- Cash out this year is about $76,717. Keep this later year in the sum for the long path.
- Later cash gets a shrink for time. At 8 percent, year 10 is worth about $37,223 today.
Add those year values. The sample NPV for Per-foot sample is about $444,758. This is a teaching sample, not a client result.
Trusted sources
These are public references. They are not endorsements and not client results.
How to use this with OccupancyNPV
This page answers the concept. OccupancyNPV applies it inside a DealWorkspace: enter lease scenarios, review cash-flow and occupancy cost, then compare NPV and discount-rate sensitivity. OccupancyNPV NPV is not the same as a face-rent comparison. OccupancyNPV is not a CRM or lease-administration suite, and this page is not legal or investment advice.
Next: start the 3-day free trial, open pricing, or continue through related product paths.