
How it works
Write the cash list first. Then decide what the page is measuring.
- Abstract each offer into money lines.
- Normalize lease type and dates.
- Discount both streams at one rate.
- Show a flip case.
- Write the recommendation in one page.
Formula in words. Broker compare = normalized stacks + one rate + one flip case + a written pick.
| Input | Meaning |
|---|---|
| LOI or proposal | The raw offer |
| Extra history | CAM, tax, insurance |
| Credits | Free rent and TI |
| Client rate | Cost of capital or agreed rate |
Worked example
Here is a teaching sample. It is not customer data and not a result from a live client.
| Metric | Lease A | Lease B |
|---|---|---|
| Start rent | $45,500 | $42,315 |
| Year-1 extras | $8,800 | $9,416 |
| Year-1 credit | $19,000 | $10,450 |
| Sample NPV | $390,494 | $379,145 |
| Year | Rent | Extras | Credit | Cash out | Value today |
|---|---|---|---|---|---|
| Year 1 | $45,500 | $8,800 | $19,000 | $35,300 | $32,685 |
| Year 2 | $46,774 | $9,064 | $0 | $55,838 | $47,872 |
| Year 3 | $48,084 | $9,336 | $0 | $57,420 | $45,582 |
| Year 4 | $49,430 | $9,616 | $0 | $59,046 | $43,401 |
| Year 5 | $50,814 | $9,904 | $0 | $60,718 | $41,324 |
| Year 6 | $52,338 | $10,201 | $0 | $62,539 | $39,410 |
| Year 7 | $53,908 | $10,507 | $0 | $64,415 | $37,586 |
| Year 8 | $55,525 | $10,822 | $0 | $66,347 | $35,845 |
| Year 9 | $57,191 | $11,147 | $0 | $68,338 | $34,186 |
| Year 10 | $58,907 | $11,481 | $0 | $70,388 | $32,603 |
| Sample NPV | — | — | — | — | $390,494 |
How to read the sample
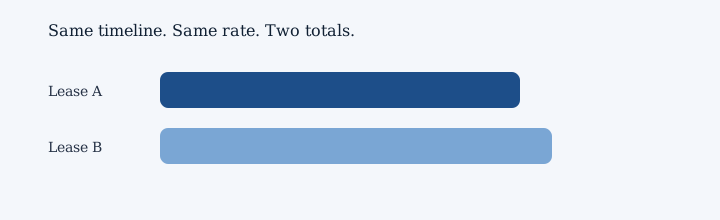
Sample NPV for Broker-compare sample is about $390,494. A second path lands near $379,145. That gap is a talking point, not a promise.
Year notes for Broker-compare sample
- Year 1 of Broker-compare sample has rent of $45,500.
- Shared building cost is $8,800.
- A credit of $19,000 lowers the cash you pay that year.
- Cash out this year is about $35,300. The credit is the talking point in year one.
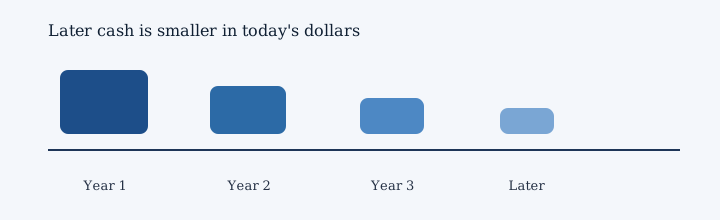
- Later cash gets a shrink for time. At 8 percent, year 1 is worth about $32,685 today.
- Next, year 2 rent is $46,774.
- CAM, which is a shared building cost, is $9,064.
- There is no credit in this year.
- You pay about $55,838 this year after extras and credits. Year two is the first clean bill.
- Time shrinks later cash. At 8 percent, year 2 is worth about $47,872 today.
- Then year 3 rent is $48,084.
- Extras for the building come to $9,336.
- Credits skip this year.
- The net cash this year is about $57,420. The bump starts to show the true rent.
- Waiting has a price. At 8 percent, year 3 is worth about $45,582 today.
- After that, year 4 rent is $49,430.
- The shared building cost this time is $9,616.
- No extra credit shows up this year.
- Cash out this year is about $59,046. Later years are where sticker math fails.
- Later cash gets a shrink for time. At 8 percent, year 4 is worth about $43,401 today.
- In year 5 of Broker-compare sample, rent is $50,814.
- Shared building cost is $9,904.
- There is no credit in this year.
- You pay about $60,718 this year after extras and credits. The last year is still in the client total.
- Time shrinks later cash. At 8 percent, year 5 is worth about $41,324 today.
- Year 6 of Broker-compare sample has rent of $52,338.
- CAM, which is a shared building cost, is $10,201.
- Credits skip this year.
- The net cash this year is about $62,539. Keep this later year in the sum for the sample.
- Waiting has a price. At 8 percent, year 6 is worth about $39,410 today.
- Next, year 7 rent is $53,908.
- Extras for the building come to $10,507.
- No extra credit shows up this year.
- Cash out this year is about $64,415. The row still belongs in the sum for the long path.
- Later cash gets a shrink for time. At 8 percent, year 7 is worth about $37,586 today.
- Then year 8 rent is $55,525.
- The shared building cost this time is $10,822.
- There is no credit in this year.
- You pay about $66,347 this year after extras and credits. Keep this later year in the sum for the long path.
- Time shrinks later cash. At 8 percent, year 8 is worth about $35,845 today.
- After that, year 9 rent is $57,191.
- Shared building cost is $11,147.
- Credits skip this year.
- The net cash this year is about $68,338. The row still belongs in the sum for the long path.
- Waiting has a price. At 8 percent, year 9 is worth about $34,186 today.
- In year 10 of Broker-compare sample, rent is $58,907.
- CAM, which is a shared building cost, is $11,481.
- No extra credit shows up this year.
- Cash out this year is about $70,388. Keep this later year in the sum for the long path.
- Later cash gets a shrink for time. At 8 percent, year 10 is worth about $32,603 today.
Add those year values. The sample NPV for Broker-compare sample is about $390,494. This is a teaching sample, not a client result.
Trusted sources
These are public references. They are not endorsements and not client results.
How to use this with OccupancyNPV
This page answers the concept. OccupancyNPV applies it inside a DealWorkspace: enter lease scenarios, review cash-flow and occupancy cost, then compare NPV and discount-rate sensitivity. OccupancyNPV NPV is not the same as a face-rent comparison. OccupancyNPV is not a CRM or lease-administration suite, and this page is not legal or investment advice.
Next: start the 3-day free trial, open pricing, or continue through related product paths.