
lease sensitivity analysis
What decision risks does lease sensitivity reveal?
What decision risks does lease sensitivity reveal?
Sensitivity shows which assumption can swap the winner and which gap is too thin to trust.
This page belongs to a lease comparison product. Public rollout remains controlled. Live checkout is available for Professional and Per-Deal.
Questions this page also answers
What is the short answer?
Sensitivity shows which assumption can swap the winner and which gap is too thin to trust.
What should you change first?
Change this page's input and hold the rate still.
What must stay visible?
The rate, the extras, and the year the credit lands.
What should you open next?
Open Which lease assumptions flip a ranking first and keep the same stack.
Plain-language definition
Sensitivity shows which assumption can swap the winner and which gap is too thin to trust.
Start with cash you can date. Leave slogans off the sheet.
Add extras the tenant still pays.
Keep one visible rate so a later reader can check the work.
Name the method in plain words.
This page sits under Lease sensitivity analysis.
Need the next step? Open Which lease assumptions flip a ranking first.
See How should you present lease scenarios to a CFO when you want the nearby walk.
Open Why use sensitivity analysis on a commercial lease if this page is not the last step.
Investopedia defines net present value as later cash brought back to today. See Investopedia on NPV.

Why it matters
This question still needs a dated cash walk: What decision risks does lease sensitivity reveal?
A short recap cannot carry a year-by-year example.
The rank can flip when this input moves.
A finance lead will ask which line changed the number.
How it works
- Put the numbers on one year list with rent.
- Hold the other assumptions still.
- Use one named method to shrink or spread the cash.
- Show a second path so the gap is visible.
- Keep the rate on the same page as the pick.
Formula in words. Decision-risk uses one shared rate and one dated list.
| Input | Meaning |
|---|---|
| Start rent | First-year rent before extras |
| Extras | CAM, tax, or insurance the tenant still pays |
| Credits | Free rent or build-out money |
| Term | How many years the cash list runs |
| Discount rate | How hard later cash is shrunk |
Worked example
Here is a teaching sample. It is not customer data and not a result from a live client.
| Metric | Path A | Path B |
|---|---|---|
| Start rent | $43,000 | $39,990 |
| Year-1 extras | $9,500 | $10,165 |
| Year-1 credit | $9,000 | $4,950 |
| Sample NPV | $388,046 | $374,093 |
| Year | Rent | Extras | Credit | Cash out | Value today |
|---|---|---|---|---|---|
| Year 1 | $43,000 | $9,500 | $9,000 | $43,500 | $40,278 |
| Year 2 | $44,290 | $9,785 | $0 | $54,075 | $46,361 |
| Year 3 | $45,619 | $10,079 | $0 | $55,698 | $44,215 |
| Year 4 | $46,987 | $10,381 | $0 | $57,368 | $42,167 |
| Year 5 | $48,397 | $10,692 | $0 | $59,089 | $40,215 |
| Year 6 | $49,849 | $11,013 | $0 | $60,862 | $38,353 |
| Year 7 | $51,344 | $11,343 | $0 | $62,687 | $36,577 |
| Year 8 | $52,884 | $11,683 | $0 | $64,567 | $34,884 |
| Year 9 | $54,471 | $12,033 | $0 | $66,504 | $33,269 |
| Year 10 | $56,105 | $12,394 | $0 | $68,499 | $31,728 |
| Sample NPV | — | — | — | — | $388,046 |
Sample NPV for Decision-risk sample is about $388,046. A second path lands near $374,093.
Year 1 of Decision-risk sample has rent of $43,000.
Shared building cost is $9,500.
A credit of $9,000 lowers the cash you pay that year.
Cash out this year is about $43,500. Year one carries the Decision-risk sample credit.
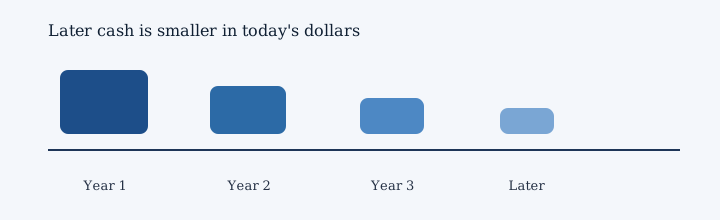
Later cash gets a shrink for time. At 8 percent, year 1 is worth about $40,278 today.
Next, year 2 rent is $44,290.
Assumptions
- The Decision-risk sample uses one visible 8 percent rate.
- Credits hit in year one unless the page says otherwise.
- Both options share the same extra basis.
- No percentage rent sits in this teaching walk.
Edge cases
A mid-year start needs a stub period, not a fake full year.
A credit that pays later must move to that later year.
A cap on extras changes the later risk, not the first sticker.
Common mistakes
- Copying a nearby page and only changing the title.
- Hiding the rate.
- Dropping extras on a net path.
- Calling the teaching sample a live client result.
Decision implications
Sensitivity shows which assumption can swap the winner and which gap is too thin to trust.
If the gap is thin, show a second rate before anyone picks.
If one path wins only from a mistimed credit, rebuild the list.
This page answers one question. Nearby pages cover the next step.
See Which lease assumptions flip a ranking first when you need that next step. Open How should you present lease scenarios to a CFO for the nearby walk. Use Why use sensitivity analysis on a commercial lease if you want a second path.
Limits
- The number does not score daylight, transit, or floor plate.
- The number does not replace a legal read.
- Do not let one metric pick a space the team cannot use.
- Do not use this page as a clone of a nearby question.
U.S. BLS describes how brokers advise clients on property deals. See BLS broker occupation data.
Next step
This site is a lease comparison product. Public rollout remains controlled. Live checkout is available for Professional and Per-Deal.
Ready for a bounded next step? Start Free Trial or see how it works and compare commercial leases.
What does lease sensitivity analysis show? · Why use sensitivity analysis on a commercial lease? · How does discount-rate sensitivity change a lease ranking? · How should you present lease scenarios to a CFO? · What is the difference between sensitivity analysis and scenario analysis? · How does rent-escalation sensitivity change a lease ranking? · How does CAM sensitivity change a lease ranking? · Which lease assumptions flip a ranking first?
Trusted sources
These are public references. They are not endorsements and not client results.
How to use this with OccupancyNPV
This page answers the concept. OccupancyNPV applies it inside a DealWorkspace: enter lease scenarios, review cash-flow and occupancy cost, then compare NPV and discount-rate sensitivity. OccupancyNPV NPV is not the same as a face-rent comparison. OccupancyNPV is not a CRM or lease-administration suite, and this page is not legal or investment advice.
Next: start the 3-day free trial, open pricing, or continue through related product paths.