
Rent is one line
What is occupancy cost, and how is it different from rent? Rent is the contractual base for the space. Occupancy cost is rent plus recoverable and tenant-paid operating expenses—CAM, taxes, insurance, utilities where tenant-paid, parking, and other lines the lease assigns to the tenant on the same timeline. Comparing rent alone ignores the cash the tenant actually spends to occupy, which is why occupancy cost is the honest tenant metric for apples-to-apples compares.
Which lines sit beside rent? CAM is the usual recovery for shared operating costs. Property taxes and insurance pass through on many net leases. Utilities may be separately metered or embedded depending on the lease. Parking, janitorial, and security sometimes appear as separate charges. Copy the included-expenses list so you know what belongs in the occupancy-cost table instead of guessing from a prior deal.
When does a cheaper face rent lose? When higher recoveries produce higher year-one occupancy cash on an occupancy-cost table even though base rent looked friendly. A simple illustration: $24 rent plus CAM $8 equals $32 occupancy cash per square foot; $28 rent plus CAM $3 equals $31—the lower face rent lost here because recoveries flipped the ranking. Higher recoveries and shorter free rent are common reasons cheaper rent loses on occupancy-cost NPV across a full term.
How should first-year CAM be labeled? Use a labeled occupancy-cost estimate, not a finished bill. Estimated CAM is a budget; reconciled CAM arrives later. Accept the estimate only with backup and expect reconciliation. The CAM first-year article explains estimates versus stops versus base years; this page keeps the vocabulary consistent so your table labels match your lease packet.
Nominal occupancy cost adds cash by year; discounted occupancy cost applies a labeled discount rate for NPV compares. Rent alone answers neither view. Occupancy-cost NPV discounts tenant paths; it is not a property cap rate and not building valuation math. Buyers use NOI and price; tenants use rent plus recoveries—keep those books separate even when the same people attend one meeting.
What sits beside rent
Recoveries respond to expense stops, base years, gross-up clauses, and caps. Two tenants with the same face rent can pay different occupancy cost if recovery mechanics differ. Free rent reduces base rent in abatement months but may not reduce CAM, so occupancy cost during abatement can still surprise teams that budgeted only face rent.
Tenant improvement allowances reduce tenant cash out; tenant-paid buildout increases it. Security deposits affect upfront liquidity. Concessions packaged as net effective rent should unpack into base rent and free rent on the occupancy-cost table so recoveries stay visible instead of disappearing into one smooth number.
Build an occupancy-cost table with rent, CAM, tax, insurance, utilities, parking, and one-time lines on the same timeline before you open compare tools. Stub-year proration matters when commencement is mid-year; do not compare full-year CAM quotes to stub occupancy without adjustment.
Common mistakes include a rent-only compare, treating CAM as a finished bill, inventing market-average recoveries, and using property valuation language for tenant decisions. Occupancy cost is rent plus recoverable lines; mixing in buyer yield vocabulary corrupts tenant committees.
This page is general information, not legal advice, and not automatically the lease you should sign. Limitation: it does not replace the lease-input checklist or the one-timeline compare article. What is still out of scope? Full building valuation and investor rate forecasting—those belong on other OccupancyNPV notes.
When cheaper face rent loses
What is occupancy cost versus rent? Rent plus recoverable lines on the same timeline. Which lines sit beside rent? CAM, tax, and insurance commonly. When does cheaper face rent lose? Higher recoveries and higher year-one occupancy cash on the table. How should first-year CAM be labeled? Labeled occupancy-cost estimate, not a finished bill, with reconciliation later.
Tenants negotiating should speak in occupancy cost because landlords understand recoveries repeat every year. Owners comparing bids should require occupancy-cost tables so face rent marketing does not hide CAM-heavy structures. Internal reporting should separate rent growth from recovery growth so operators see why occupancy cost rose when rent looked flat.
Retail percentage rent, industrial gross bundles, and coworking all-in pricing still map to what the tenant pays—translate labels back to occupancy cost before you rank deals. Reconciliation can raise or lower occupancy cost after year one; until then, keep projected versus reconciled labels visible.
Related OccupancyNPV reading: CAM first-year labeling, lease-number checklist, and one-timeline compare. Request the included-expenses list, build the table, label first-year CAM, compare on one timeline, and use OccupancyNPV when paths are sourced rather than invented.
Accept the estimate when backup exists; ask for backup when estimates look thin; leave cells blank rather than inventing averages. When occupancy cost and rent diverge widely, negotiate recoveries and caps, not only face rent, because recoveries compound across the term.
Label first-year CAM honestly
Parking, storage, after-hours HVAC, and separately metered utilities belong in occupancy cost when the tenant pays them. TI and free rent belong in the years cash moves. Multiyear tables expose when a cheap rent year subsidizes expensive recovery years later—face rent alone hides that pattern.
OccupancyNPV discounts labeled paths and will not fix rent-only compares. When landlords refuse to define included expenses, label uncertainty instead of pretending precision. After reading, rebuild your table whenever proposal drafts change so committee never cites stale occupancy-cost rankings.
When does a cheaper face rent lose? When higher recoveries on an occupancy-cost table produce higher year-one cash than the competing quote even though base rent looked lower on the cover page. Always build the occupancy-cost table before you celebrate a rent concession.
Rent plus recoverable expenses equals the core identity of occupancy cost. Recoverable CAM, taxes, and insurance are the usual companions; tenant-paid utilities and parking join when the lease assigns them. Face rent alone is incomplete for any committee decision about which lease is cheaper to occupy.
Year-one cash from the occupancy-cost table tells treasury what happens immediately; discounted occupancy cost tells strategy what happens across the term. Both views use occupancy cost, not rent alone, because recoveries often dominate year one in CAM-heavy buildings.
Nominal and discounted occupancy cost
Expense stops cap exposure; gross-up adjusts CAM when occupancy is low; base years reset comparisons. Each mechanism changes occupancy cost while face rent on the proposal cover stays unchanged, which is why tenants must read recovery clauses before they rank deals.
First-year CAM belongs as a labeled occupancy-cost estimate, not a finished bill, until reconciliation closes the year. Treating the estimate as final is a common mistake that makes rent-only and occupancy-cost rankings diverge after the true-up arrives.
Property valuation and cap rate math stay off this page. Tenant occupancy-cost NPV and occupancy cost tables stay on this page. Crossing those streams produces confident wrong answers in mixed buyer-tenant meetings.
Janitorial, security, landscaping, and common utilities typically sit in CAM when the lease says so; capital items and separately metered utilities typically sit outside unless merged by contract language you can cite.
Multiyear occupancy-cost tables show when a landlord front-loads cheap rent and back-loads recoveries—face rent charts hide that shape unless you plot occupancy cost by year.
Not building valuation
Negotiate recoveries when occupancy cost diverges from rent, not only when rent feels high, because recoveries repeat and compound while a one-time rent cut does not fix a gross-up clause.
Use the lease-input checklist before compare, then the one-timeline compare article after tables are sourced. OccupancyNPV fits last as a discounting engine, not as a substitute for defining occupancy cost versus rent.
Stub-year occupancy, TI timing, and free rent months are timing issues that change occupancy cost without changing the definition: still rent plus recoveries on the timeline you label.
Landlords marketing net effective rent hope tenants ignore occupancy cost; tenants should respond with an occupancy-cost table request alongside any rent counter. The table forces recoveries into daylight where face rent negotiations often hide them.
CAM caps limit growth of recoveries; without reading caps, tenants assume CAM estimates are stable when they may jump after cap expiry—occupancy cost by year reveals that cliff while rent alone looks flat.
Examples on an occupancy-cost table
Insurance and tax lines billed as separate pass-throughs should mirror on both sides of a compare table when tenants evaluate two buildings, because one building’s tax reassessment can invert a rent-favorable proposal.
Parking charges and transit subsidies interact with occupancy cost when employees consume paid stalls; even small monthly parking multiplied by headcount moves year-one cash materially in urban sites.
Occupancy cost is the tenant-side summary metric; rent is one input. Teach committees to say occupancy cost when they mean total occupy expense, and reserve rent for the contractual base line only.
After reconciliation, update the table from labeled occupancy-cost estimate to reconciled actual and revisit any decision that relied on projected recoveries—occupancy cost is a living number through the lease term.
Higher recoveries on a lower face rent lease are the classic reason occupancy cost beats rent marketing—build the occupancy-cost table, read year-one cash, then decide whether the concession was real or cosmetic.
Common mistakes
Recoverable expenses flow through CAM, tax, and insurance lines; non-recoverable tenant costs still belong in occupancy cost when the tenant writes the check. The table is the contract translated into dollars by year.
Face rent step-ups without recovery caps can leave occupancy cost climbing even when the tenant thought the deal was flat—plot both rent and recoveries across the term.
When in doubt, ask for the included-expenses list and rebuild occupancy cost from primary documents rather than from broker summaries alone.
Occupancy cost versus rent is the vocabulary shift serious tenants make before they sign: rent is the headline, occupancy cost is the truth on the same timeline, and year-one cash from the occupancy-cost table is what treasury feels first when recoveries run higher than the friendly base rent promised on the cover page.
Rent plus recoverable operating charges is the identity to remember in every meeting; everything else on this page is application of that identity to CAM, tax, insurance, concessions, and timing across the lease term you model.
Limitations and related reading
Print the occupancy-cost table for both finalists and circle year-one cash before you print face rent; the circle tells you which lease is actually cheaper to occupy even when the rent line disagrees.
Teach new hires that occupancy cost is rent plus recoveries on one timeline before you teach them any software button, because the definition prevents rent-only habits from returning every time a broker sends a one-page proposal summary.
Sublease economics and holdover rent change occupancy cost in exit years when you model departure or extension; those lines are still rent-plus-recoveries logic even when the tenant is leaving, because recoveries can run through the final month of possession. Do not drop recoveries from the tail year just because face rent abates during free-rent months unless the lease explicitly abates recoveries too.
Mixed-use and campus leases sometimes bundle services into one all-in number; unpack the bundle back into rent and recoverable lines before you compare to a triple-net quote, because an all-in headline hides whether CAM or tax drove the bundle and whether the bundle resets at renewal.
Internal dashboards that track rent per square foot without occupancy cost per square foot mislead executives when recovery inflation outpaces rent growth; add an occupancy-cost column beside rent so leadership sees the metric treasury actually pays, not the metric landlords prefer to advertise on proposal covers.
Is occupancy cost the same as CAM?
No. Occupancy cost includes rent plus recoveries; CAM is one recovery line.
Is first-year CAM a final bill?
Usually not. Label it as an estimate until reconciliation.
Can I compare rent only?
Not reliably when recoveries differ materially between leases.
Related resources
CAM in the first year · Interest rates and value · Cap rate hub · Compare leases
Featured Reads

How does free rent affect occupancy cost for tenants?
Free rent abates base rent in stated months, but CAM and other recoveries often still bill. Model abatement timing, TI, and recoveries on one occupancy-cost timeline before you trust net effective rent.
· 13 min read
Read moreWhat is the difference between an expense stop and a base year for tenants?
An expense stop caps tenant recoveries at a stated level; a base year bills tenant share of operating expenses above a documented baseline year. Both change occupancy cost while face rent stays flat.
· 12 min read
[ Expense Stop ] [ Base Year ]
Read more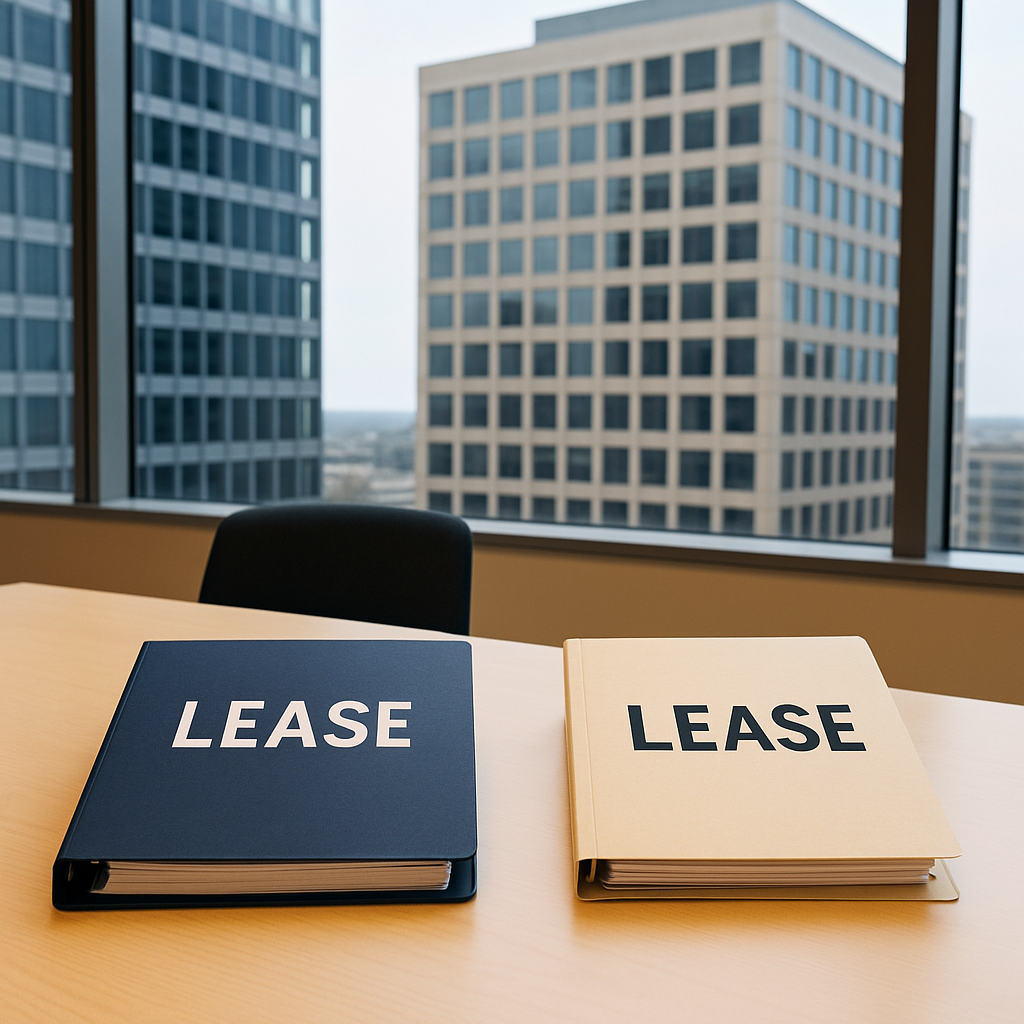
What is the difference between a gross lease and a net lease for tenants?
Gross leases bundle operating costs into the rent quote; net leases separate base rent from CAM, tax, and insurance recoveries. Compare occupancy cost, not headline rent alone.
· 14 min read
Read more
How should a tenant treat CAM in the first operating year?
Treat first-year CAM as a labeled occupancy-cost estimate, not a finished bill. Compare it on the same timeline as rent.
· 14 min read
Read more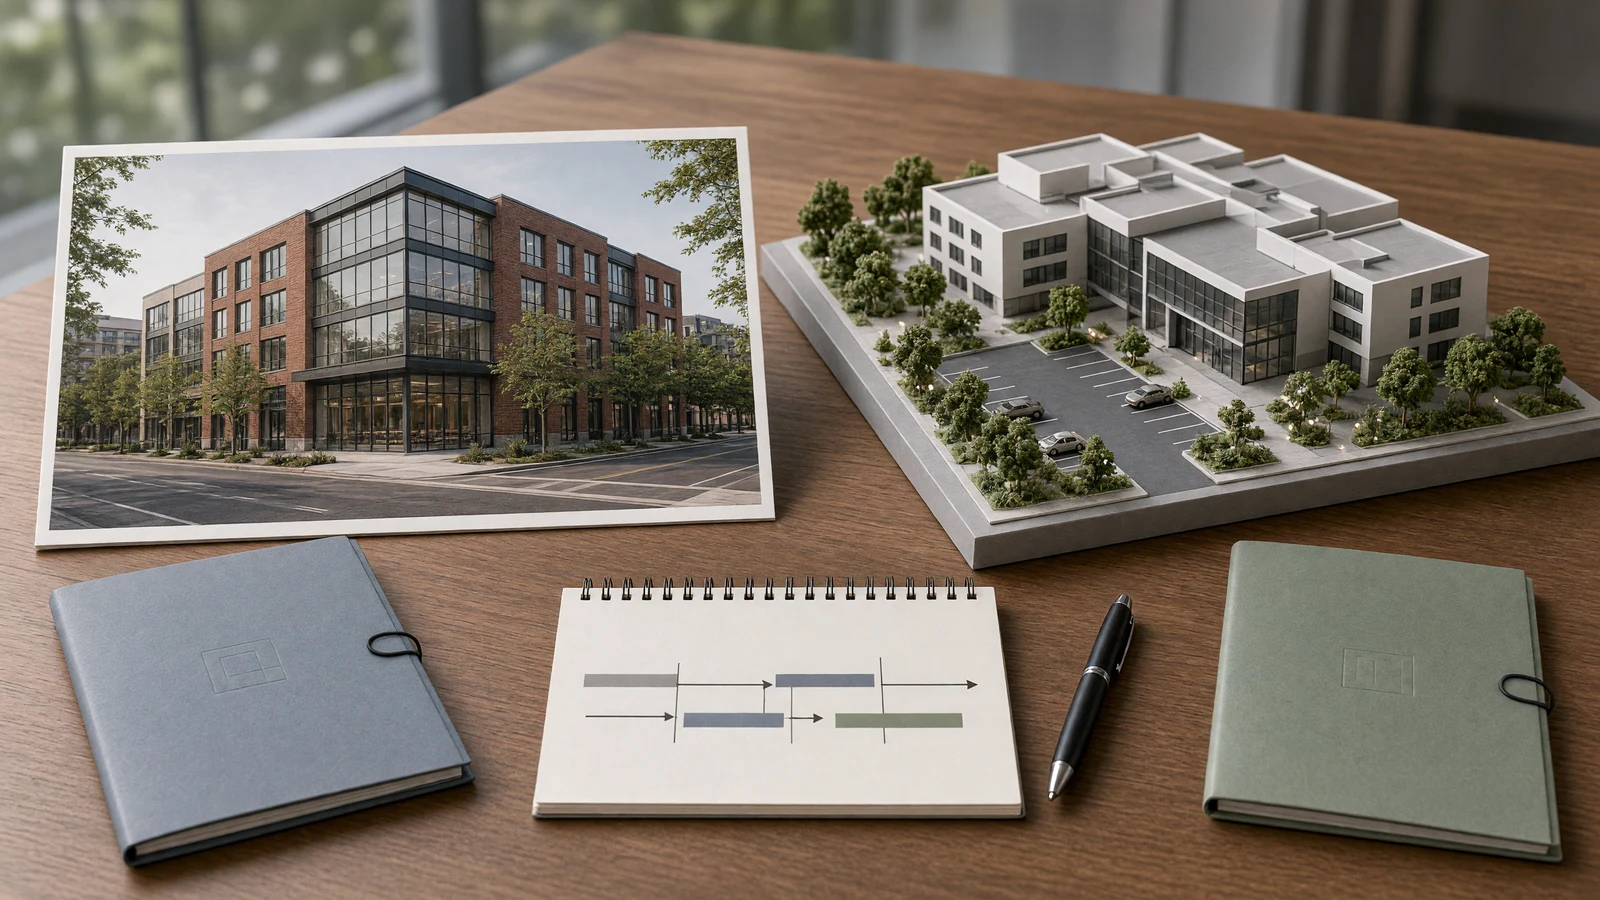
How do you compare two commercial lease options on one timeline?
Put both occupancy-cost paths on the same years, discount them, and keep tenant NPV separate from a building cap rate.
· 11 min
Read moreWhat numbers do you need before you compare two commercial leases?
A checklist of rent, recoveries, free rent, TI, and term. Missing one line is how a cheaper face rent still loses.
· 11 min
Read more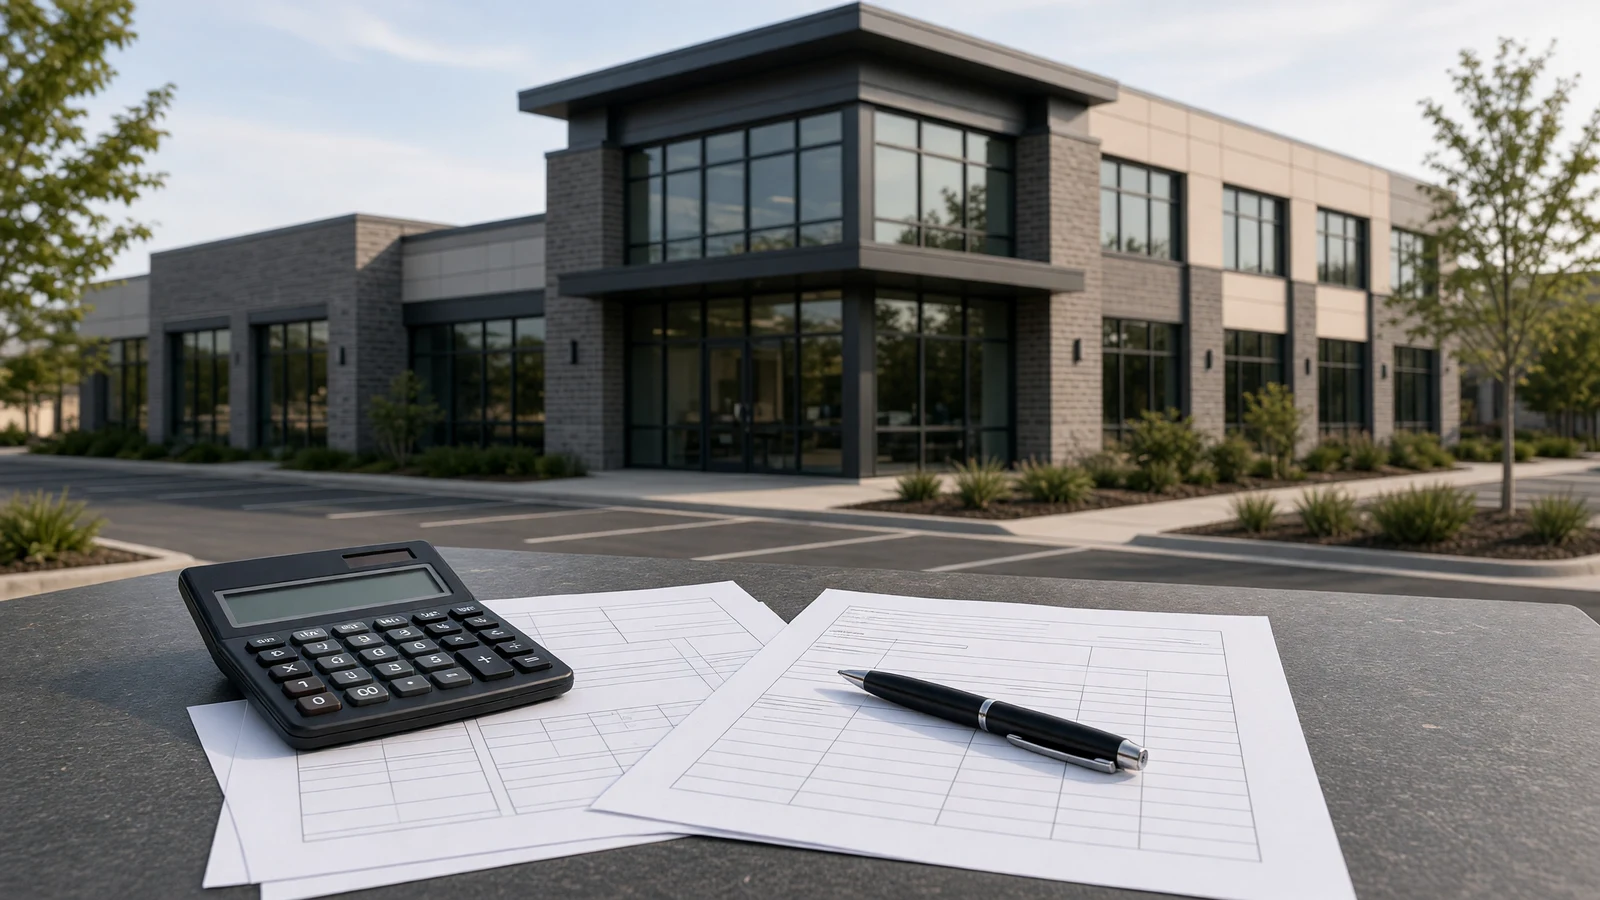
How is cap rate calculated for a commercial building?
Cap rate is NOI divided by value or price. Name the NOI, name the price, and do not treat a tenant occupancy-cost number as a property yield.
· 11 min
Read more
How do interest rates affect commercial property values?
Financing costs change the yield buyers require. Same NOI at a higher cap rate is a lower indicated value. This is a property-valuation story, not a tenant lease NPV.
· 16 min read
[ Interest Rates ] [ Cap Rates ]
Read moreFeatured Reads
- How should a tenant treat CAM in the first operating year?
Treat first-year CAM as a labeled occupancy-cost estimate, not a finished bill. Compare it on the same timeline as rent.
- What numbers do you need before you compare two commercial leases?
A checklist of rent, recoveries, free rent, TI, and term. Missing one line is how a cheaper face rent still loses.
- What is the difference between an expense stop and a base year for tenants?
An expense stop caps tenant recoveries at a stated level; a base year bills tenant share of operating expenses above a documented baseline year. Both change occupancy cost while face rent stays flat.